Quarterly Investment Letter
1st Quarter 2018
Despite mostly strong January performance, global equity markets generally shed value for the first quarter of 2018. Concerns arose that strong economic growth in some parts of the world, particularly the United States, would lead central banks to increase interest rates sooner than expected. A selloff in technology firms amid concerns about consumer data privacy and potentially tighter regulatory controls in the sector affected many developed markets. Sentiment was also dampened by worries that a trade war could develop following protectionist moves by the Trump administration. The MSCI All Country World Index generated a -0.84% total return for the first three months of the year, in its first quarterly decline in two years.1 Emerging-market stocks, as measured by MSCI indexes, advanced and outperformed the global index as well as their developed-market peers, which generally declined.1 Regionally, Latin American markets surged, and Asian bourses eked out a small gain.1 US equities retreated but fared better than the global index, while European equities collectively fell further than the other main groupings.1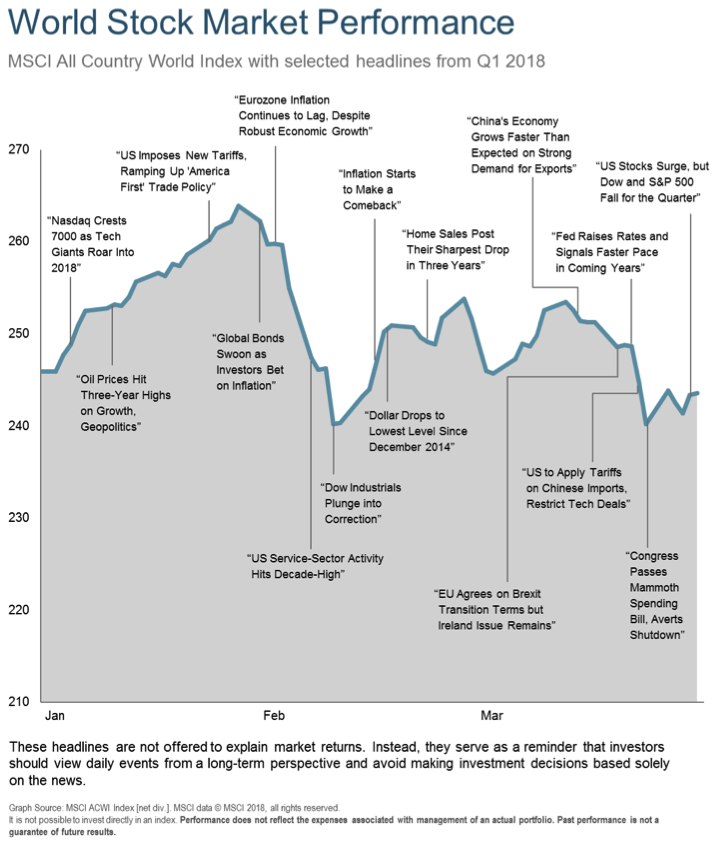
Earnings reports showed many US companies posting their best results in years. At its March 2018 monetary policy meeting, the US Federal Reserve (Fed) raised its benchmark interest rate. It also lifted its 2018 US growth forecast but maintained its projection of three rate hikes this year. Data released in March showed the US economy expanded at a 2.9% annualized rate in 2017’s fourth quarter, compared with 3.2% gross domestic product (GDP) growth in the third quarter.2 Unemployment held at 4.1% through February, the lowest reading since 2003.3 The tightening US labor market could force companies to pay higher wages, which has fed into inflation assumptions.
In Europe, investors took little cheer in corporate earnings reports and appeared to focus on the risk of escalating trade tensions and the selloff in technology shares. Concerns that interest rates in the United States would rise sooner than expected, which tends to be a headwind for stocks, and signals by the European Central Bank that its stimulus measures could be withdrawn in the near future also affected sentiment. Europe’s GDP in 2017 grew by 2.3%.4
Worries about the potential impact of new tariffs on global trade restrained many Asian equity markets during the quarter. China’s preliminary GDP figure for 2017 indicated growth of 6.9%, beating consensus expectations and the country’s target.5
Looking Forward
Valuation is an important component we follow, along with Monetary Policy, Investor Psychology, and the Market Trend. In this Quarter’s “Looking Forward” we are reviewing a few of the stock market valuation metrics we follow. To borrow a phrase which is often applied to real estate, “You make your money when you buy something, not when you sell it.” While this phrase has some Yogi Berra type language, the point is that if you buy something when it is inexpensive, you can make a profit by selling when some value has recovered, even if you don’t sell at the most ideal time. But if you pay a precious price for an investment, things must go well for you to make a profit.
Stock valuation is often a poor predictor of short-term returns, (1-3 years), but has historically provided insight into the opportunities which will play out over the longer term, (10-12 years). Sometimes markets are expensive but become very expensive, and sometimes markets are inexpensive but then become down right cheap. The core of what gives a stock value is that it is ownership in a real company and as the owner, you are entitled to a portion of the future earnings created by the company. A common way to consider what we are paying for a company, (and those future earnings), is called the Price-to-Earnings Ratio (PE). Simply put, if the PE is 12x, then we are paying 12 dollars for every 1 dollar in earnings. When determining value, consideration must also be given to how sustainable those earnings are, and to how fast those earnings are growing.
The following chart does a good job of showing how investment returns are often driven by the price you pay for something. In this case, the orange bars on the left side of the chart show US stock market returns when the market was less expensive, and the right side shows what returns were when the market was more expensive. By using the Forward Price-to-Earnings Ratio to determine valuation, we are taking into account the recent tax cuts. The current valuation of the US stock market as defined by the S&P 500 can be seen in the gray circle.
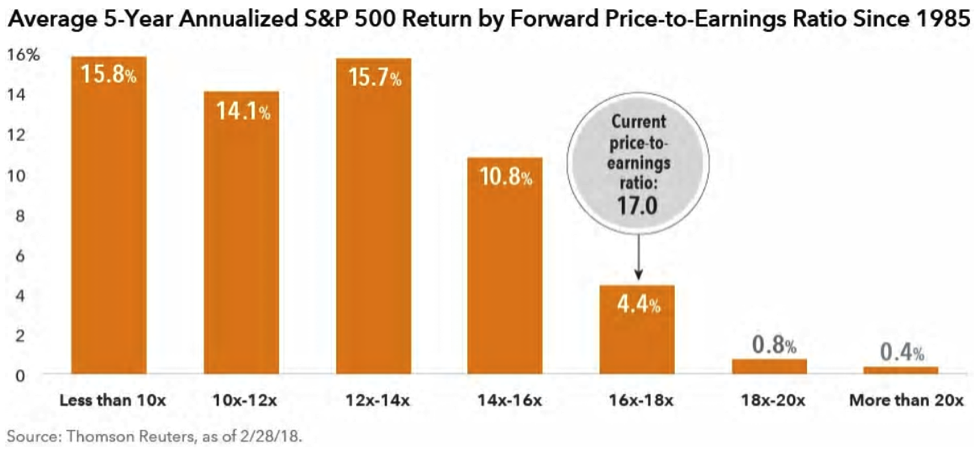
There are always exceptions, and last year is a good example of an exception when we had excellent returns in the US despite high valuations. This chart uses a 5-Year annualized return to smooth out those exceptions. It should also be noted that the average PE ratio of the last 25 years is actually 16.1x. So while current levels are high, they are not astronomical.
Another way to look at value is to consider the “Earnings Yield” of stocks versus bonds. This approach is based on comparing the earnings generated by a company as a percentage of the value of the company and comparing that to the yield an investor could obtain by owning a bond. In general terms, this metric indicates stocks are fairly valued when the yields are the same. This is because bonds provide stability of income, but stocks can provide growth of income. As of the printing of this letter, the Earnings Yield of the US market as defined by the S&P 500 rests around 6.1% and the 10 year US Treasury bond is paying around 3%. In a vacuum, this indicates an undervalued market, but in the real world, we must also consider the extent to which the bond yields have been held down by the Reserve Banks of the world, including the US Federal Reserve.
On the other end of the spectrum is yet another way to value markets. Instead of using earnings as a valuation method, we can use gross revenues. This method has credence because it disregards profit margins which are currently high but can fluctuate. (If inflation continues to increase, profit margins will likely come under pressure.) This metric is certainly concerning as it paints a picture of a market which is very expensive compared to the past 32 years.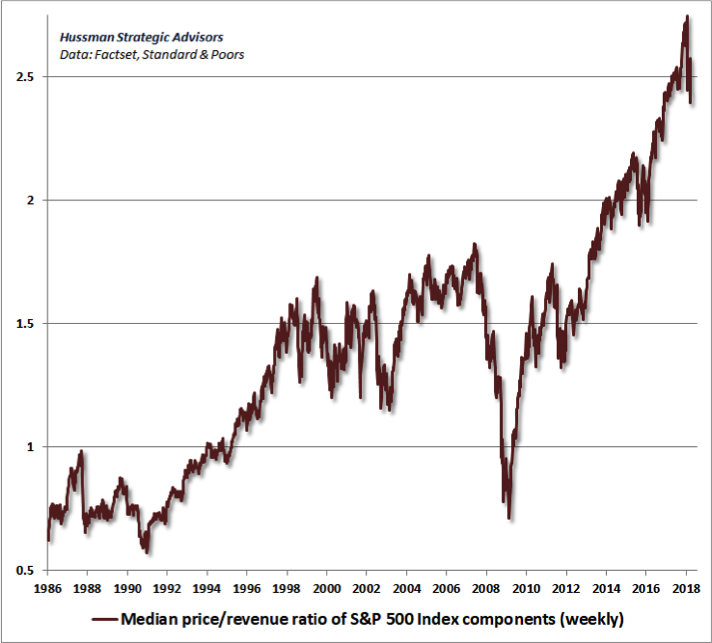
So valuation metrics are showing a mixed bag, but certainly, indicate the possibility of overvaluation. How should our investment approach change? Following are some of our thoughts and adjustments for our Core Strategies due to current valuations:
- •With our Market Capture Strategy, we remain fully invested to “capture” whatever the market will provide. We don’t know the future, and it can always be different than the past, so we remain invested. We have maintained a higher than normal allocation to international developed and emerging markets stocks compared to our US holdings due to the relative value in those markets.
- •With our Risk Managed Strategy we have reduced risk. This isn’t as much a prediction of the future as a willingness to admit the risk of stocks declining in this environment is higher than normal. Valuations are high; monetary policy is not as accommodative, Investor Psychology indicators show extremely low fear. A robot might be best off remaining invested through whatever is to come. But we are humans with real emotions, so our approach to managing your money allows us to reduce or increase risk with a portion of your investments. Though we don’t wish for it, markets and economic times ebb and flow. So the ideal time to get more aggressive would be if valuations were low, monetary policy was accommodative, and Investor Psychology indicators were showing high fear. As John Templeton famously said, “Buy when there’s blood in the streets, even if it’s some of your own.” Without being willing to hold some cash, the ability to buy at times like this is curtailed. For example, Warren Buffet’s Berkshire Hathaway company’s lowest level of cash in the past 13 years was 24.5 Billion in 2009 near the market lows. His cash holdings have steadily grown since then and are now a record 116 Billion. This shouldn’t be seen as a prediction of decline, but a prudent approach to considering valuations. His cash holdings actually hit an all-time high in 2014 at 55.5 Billion and have grown almost every quarter since.67
On the more optimistic side, we know today’s world is different than any other time in history with its own unique challenges and opportunities. The economy is strong in the US and seems to be improving all over the world.8 So while we do want to actively manage risk, we are certainly hopeful for a continued period of economic expansion. Historical examples of averages smooth out times of booming economies, but booms can happen, and many economic signs currently point in that direction.
In summary:
- 1.Valuation metrics differ on whether the US stock market is overvalued or undervalued, but some overvalued metrics indicate excessive overvaluation.
- 2.Current Forward-Price-to-Earnings Ratios indicate returns have historically averaged 4.4% from similar valuations. While this is not exciting, it still compares well with current bond yields.
- 3.International stock markets are generally less expensive than the US market.
- 4.Our Market Capture Strategy remains invested, but our Risk Managed Strategy has reduced risk. We see merit in both strategies and feel you are best served with this dual approach and appropriate diversification based on your goals and risk tolerance.
If you have thoughts or questions about any of the information we’ve shared or on any other subject, please don’t hesitate to call us. We are grateful you allow us to serve you and your family and we will continue to make every effort to earn the trust you’ve bestowed on us.
Sincerely,
Your CCA Investment Team
Advisory services offered through Cravens & Company Advisors, LLC, a Registered Investment Advisory Company. Securities offered through, and advisory services may also be offered through, FSC Securities Corporation, an Independent Registered Broker/Dealer. Member FINRA/SIPC and a Registered Investment Advisor. Not affiliated with Cravens & Company Advisors, LLC.
Investing involves risk including the potential loss of principal. Investing involves risk including the potential loss of principal. International investing involves additional risks including risks associated with foreign currency, limited liquidity, government regulation, and the possibility of substantial volatility due to adverse political, economic and other developments. The two main risks associated with fixed income investing are interest rate and credit risk. Typically, when interest rates rise, there is a corresponding decline in the market value of bonds. Credit risks refer to the possibility that the issuer of the bond will not be able to make principal and interest payments. Investments in commodities may entail significant risks and can be significantly affected by events such as variations in the commodities markets, weather, disease, embargoes, international, political, and economic developments, the success of exploration projects, tax, and other government regulations, as well as other factors. No investment strategy can guarantee a profit or protect against loss in periods of declining values. Past performance is no guarantee of future results. Please note that individual situations can vary. Therefore, the information presented here should only be relied upon when coordinated with individual professional advice. Any opinions or forecasts contained herein reflect the subjective judgments and assumptions of the authors only and do not necessarily reflect the views of FSC Securities Corporation. There can be no assurance that developments will transpire as forecasted and actual results will be different. Data and analysis do not represent the actual or expected future performance of any investment product.
-
- 1. Source: © 2018 Morningstar, MSCI
- 2. Source: US Bureau of Economic Analysis
- 3. Source: US Bureau of Labor Statistics.
- 4. Source: Eurostat.
- 5. Source: National Bureau of Statistics of China.
- 6. Source: Berkshire Hathaway Annual Reports
- 7. Source: Charles Schwab
- 8. Source: Markit Global Purchasing Managers Index