Quarterly Investment Letter
4th Quarter 2018
Global equity markets suffered sharp volatility and a widespread rout in the final quarter of 2018. News flow on the US-China trade dispute drove alternating optimism and pessimism throughout the quarter. Concerns about the pace of US interest-rate hikes and signs of slowing economic growth around the world also weighed on sentiment. The MSCI All Country World Index returned -12.7% for the quarter. 1 Emerging market stocks fared much better than the global index as well as their developed-market peers, with developed markets selling off across the board.1
US stock indexes significantly declined during the fourth quarter.1 Following US midterm elections in early November, investors appeared to refocus on the economy. Though major US stock indexes delivered their best week in nearly seven years to end the month of November, they otherwise saw widespread declines amid doubts about trade policy and the strength of the global economy. Investors also appeared concerned over corporate earnings potentially softening in 2019. In December, the US Federal Reserve lifted the federal funds target rate by 25 basis points to a range of 2.25% to 2.50%. They modestly lowered their forecast for US economic growth in 2019 and implied there may be fewer interest-rate hikes in the year ahead than previously projected.2 European equity markets collectively fell during the fourth quarter.1 Tensions eased between the European Union (EU) and Italy regarding the country’s budget plans, however, continued Brexit uncertainty, concerns about the pace of US interest-rate increases, and mixed corporate earnings affected investor outlooks.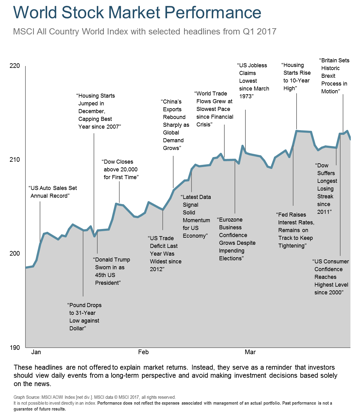
Nearly all Asian stock markets finished the quarter with declines.1 Trade relations between China and the United States continued to dominate sentiment. Additionally, economic news from China suggested the trade dispute was already affecting the economy. Weak demand for oil from China, India, and other economies across emerging Asia also suggested slowing growth and weighed on crude oil prices.
Latin American equity markets eked out a small gain for the fourth quarter entirely due to surging Brazilian shares.1 In Brazil, the election of a right-wing presidential candidate, who appeared to be favored by most investors, boosted the country’s stock market as market-friendly reforms are anticipated.
Looking Forward
Last quarter, we discussed the impact of rising interest rates in relation to both the economy and investments in general. We also touched on the expanding US government deficit. This quarter, we discuss the current market volatility and expectations of where global economic growth will occur over the next ten years.
Market Volatility
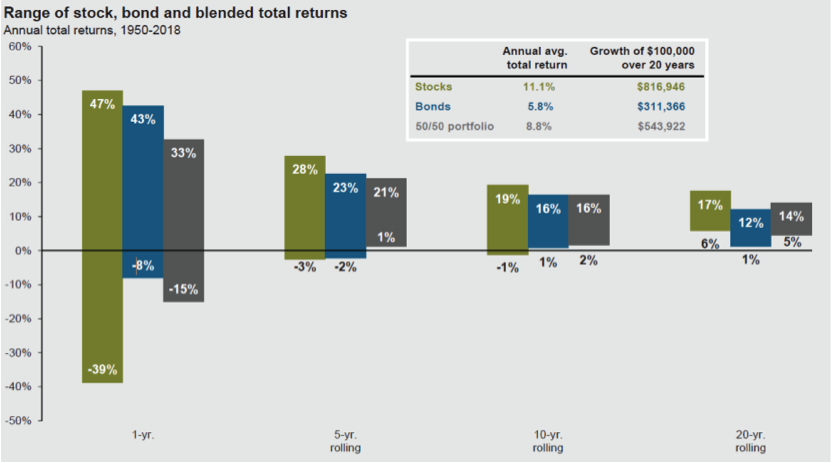
image002.png@01D4AE69.B241C1C0" >The stock market has been volatile lately, and we know you are feeling it. Investors are often encouraged to stay invested through the ups and downs instead of following emotions. As shown in the chart, when holding periods lengthen the historical distribution of outcomes narrows. While each investor has their own level of risk appropriate for them, our experience suggests investors should generally avoid increasing risk when they are excited and avoid decreasing risk when they are scared. Oddly enough, in times when investors are reviewing returns and are happy, investments have often become expensive. Juxtaposed, in times when investors are reviewing investments with displeasure, these same investments have often become less expensive. Without this approach, it is challenging to practice the mantra of “buy low and sell high.” At the time you are the most excited or the most scared, others are normally feeling those same emotions. As the adage goes, we want to be accommodating. If the average investor really wants to buy, we accommodate them and sell some to them. If the average investor really wants to sell, we accommodate them and buy some from them. Additionally, historical periods which conclude with results near the lower bound of expected returns, tend to be followed by returns near the upper bound for the following period. This is reasonable since low returns often lead to inexpensive markets, while high returns often lead to expensive markets. Restraint is certainly needed because emotional responses to investments may ignore this sound reasoning.
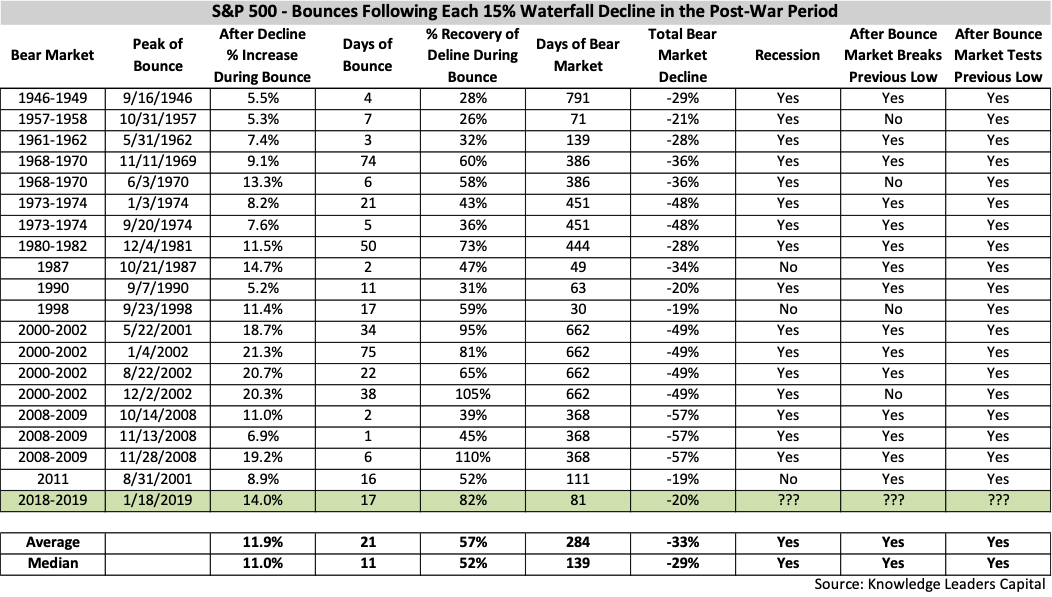
Prudent investing should focus on the long-term, but that does not mean we must always sit idly by. At times we will increase or decrease our risk level based on market conditions. The December decline in US equities was what is referred to as a “waterfall decline.” This is generally defined as a market decline of at least 15%, during which there was not an increase of even 5%. The future can always be different than the past, but the past can be a helpful guide for couching our expectations. A waterfall decline in the S&P 500 has occurred 19 times since 1946. On average the market bounced and recovered 57% of what was lost during the decline and then either went back down to the recent low point or went below the recent low point. During the December 2018 waterfall decline the US market dropped 17%, and as of this writing, has bounced to recover 82% of what was lost.3 Based on history we expect another decline which will either end at the recent low or make a new low. If this occurs, we expect investors will have a great deal of fear, and we expect to start putting some of the cash we have been holding to work. We will also be monitoring the trend of the market. If the trend is reestablished as positive, this could also be an impetus to move some of our cash into stocks. The following grid documents all 19 of the previous waterfall declines we reference. Regretfully, history suggests it is unlikely the decline is over, though we always consider how every situation may be different than previous history.
Global Growth
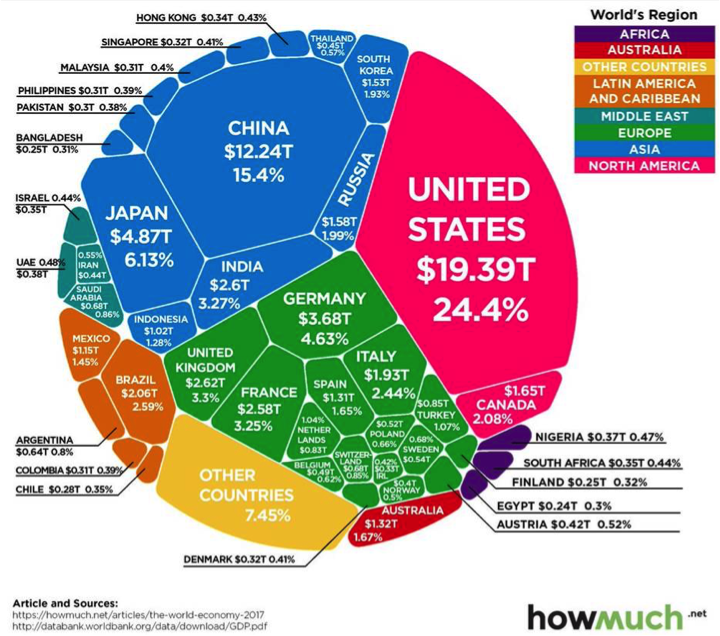
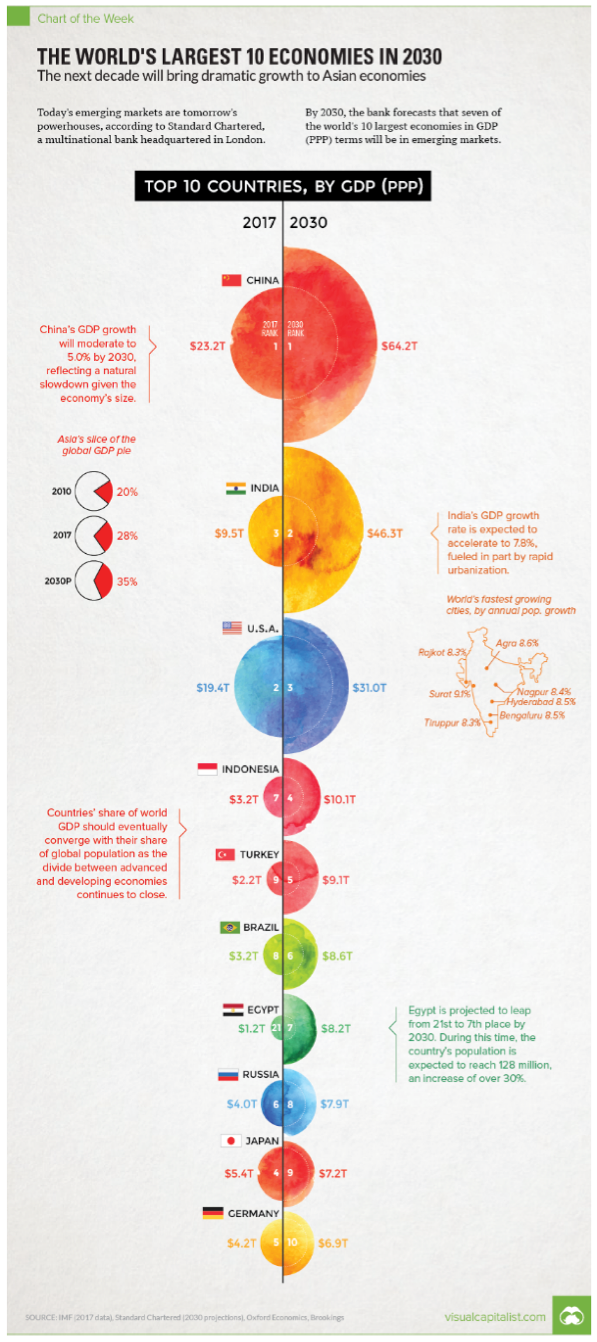
We have discussed in previous letters how the US stock market is historically expensive when measured by sales per share and in relation to the US Gross Domestic Product. This is still the case, as is the view that the market is reasonably valued when measured by earnings per share. The debate will continue in financial circles, but one thing most economists can agree on is that International Markets (represented mostly Europe and Japan) and especially Emerging Markets (represented mostly by China, India, and Latin America) are less expensive and offer better value when compared to the US stock market. This was also the case last year, but despite valuations the US market was the better investment last year. The following charts provide some insight into why we consider diversifying internationally to be a prudent and needed investment decision. If the economic camp who believes the US market is historically expensive turns out to be correct, then this diversification has the potential to help balance your investment ship. Potentially of greater importance are the projections shown in the charts on the next page of how the Emerging Markets economies will surpass the United States by 2030.
Visual of Countries Economic Output for 2017
2017 to 2030 Economic Change by Country
1. Source: © 2018 Morningstar, MSCI.
2. Source: US Federal Reserve.
3. Source: Knowledge Leaders Capital
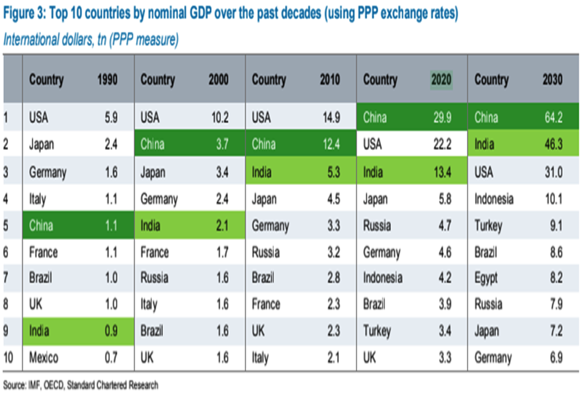
Countries Ranked by Previous and Expected Economic Output: 1990, 2000, 2010, 2020, 2030
Summary
In summary, long-term market volatility is something we must endure, but that doesn’t stop us from considering the risk level of markets and making short-term shifts with portions of your portfolio. We hope the charts provide a visual projection of how the world is expected to evolve by 2030. This evolution should and does impact our investment decisions.
If you have thoughts or questions about any of the information we’ve shared, or on any other subject, please don’t hesitate to call us. We are grateful you allow us to serve you and your family, and we will continue to make every effort to justify the trust you’ve bestowed on us.
Sincerely, Your CCA Investment Team
Advisory services offered through Cravens & Company Advisors, LLC, an SEC Registered Investment Advisory Company. Securities offered through, and advisory services may also be offered through, FSC Securities Corporation, an Independent Registered Broker/Dealer. Member FINRA/SIPC and a Registered Investment Advisor. Not affiliated with Cravens & Company Advisors, LLC.
Investing involves risk including the potential loss of principal. Investing involves risk including the potential loss of principal. International investing involves additional risks including risks associated with foreign currency, limited liquidity, government regulation, and the possibility of substantial volatility due to adverse political, economic and other developments. The two main risks associated with fixed income investing are interest rate and credit risk. Typically, when interest rates rise, there is a corresponding decline in the market value of bonds. Credit risks refer to the possibility that the issuer of the bond will not be able to make principal and interest payments. Investments in commodities may entail significant risks and can be significantly affected by events such as variations in the commodities markets, weather, disease, embargoes, international, political, and economic developments, the success of exploration projects, tax, and other government regulations, as well as other factors. No investment strategy can guarantee a profit or protect against loss in periods of declining values. Past performance is no guarantee of future results. Please note that individual situations can vary. Therefore, the information presented here should only be relied upon when coordinated with individual professional advice. Any opinions or forecasts contained herein reflect the subjective judgments and assumptions of the authors only and do not necessarily reflect the views of FSC Securities Corporation. There can be no assurance that developments will transpire as forecasted and actual results will be different. Data and analysis do not represent the actual or expected future performance of any investment product.