Market and Economic Review
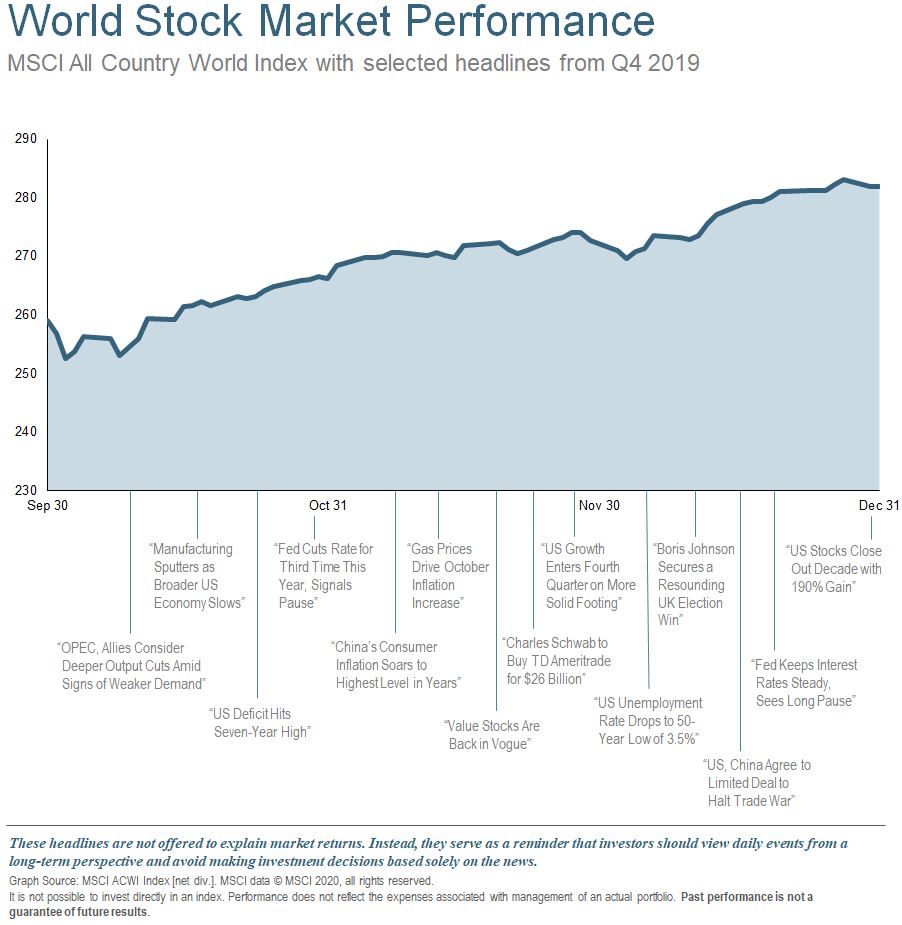
During Q4, favorable policy developments—including further monetary easing by the Federal Reserve and de-escalation of the US-China trade confrontation—provided additional fuel to power stock markets to a strong finish in 2019. The global economy remains sluggish but is showing signs that conditions are no longer deteriorating. The US is firmly in the late cycle, while recessionary conditions in major European countries such as Germany and Italy may be poised for improvement. Overall, the global cycle remains in a mature expansion, but with hints of improvement in some areas, and a bottoming in global trade and industrial activity.
Capital spending slumped in 2019 amid weak growth and trade-policy disruption, although recent sentiment indicators suggest business confidence may no longer be weakening. With companies facing an extremely tight labor market, it may be difficult for earnings growth to accelerate meaningfully without material improvement in the global economic environment. Thus, profit growth may face difficult expectations hurdle in 2020.
Earnings growth across all regions finished the year on a weak note. US profit growth continued to slow after the tax-reform boost in 2018, while non-US earnings growth spent all of 2019 in negative territory. Forward estimates point to market expectations for a significant recovery in earnings growth in 2020, which may be difficult to achieve without a sustained reacceleration of global growth.
Global economic policy uncertainty rose to unprecedented levels in recent years amid an unclear outlook for monetary policy, international trade tension, Brexit, and a host of other issues. However, world central banks’ shift to monetary easing and the de-escalation of the US-China trade conflict late in 2019 offered hope that uncertainty may prove less of a headwind for business confidence in 2020.
Looking Forward
US Stock Valuation
|
The table illustrates the valuation of the US market compared to history. On the left side of the table in blue, the S&P 500 is shown, and on the right side of the table in grey the median stock. Nine different measures of valuation are compared. A historical percentile ranks each metric on a scale of 1-100%, with 100% being the highest valuation in history, and 1% being the lowest valuation in history. The take away is that the broad market and the median stock by historical standards are very expensive based on seven of the nine metrics. Highly valued markets don’t have to go down, but they do indicate an environment of higher than normal risk. While not illustrated, note that there are portions of the market, which by these same metrics do not reflect such high valuations. This is also true of markets in several foreign countries.
From the beginning of 1998 through the end of 1999, investors witnessed an expensive market becoming even more expensive. We witnessed the concept last year and may even see it again this year. As seen below, since 2009, 62% of the market’s increase can be explained by increased earnings. The remaining 38% is attributable to investors’ willingness to pay higher prices. However, last year 91% of the change in values was driven by investors willing to pay higher prices. This situation can go on for longer than expected, but at some point, the earnings have to start increasing in order to justify the high valuations. We do not know what happens next, but vividly remember the pain involved when valuations return to normal, as they did from 2000 to 2003.
 Coronavirus
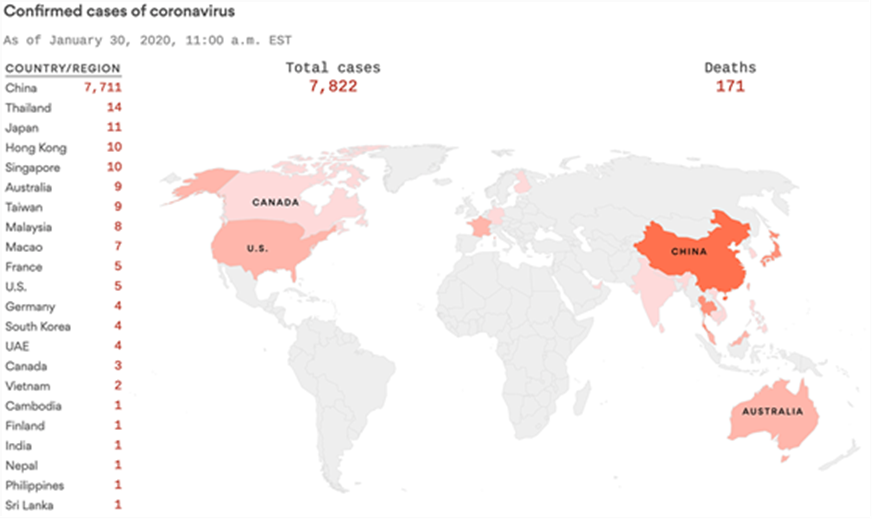
In addition to the tragic toll on human lives, the coronavirus outbreak in China brings potential economic and market implications for China and beyond. The situation is at an early stage and is evolving quickly. Both market and economic implications depend on the severity and duration of this epidemic. Cases continue to surge and are now over 9,700 and have resulted in 213 deaths.
Based on reported figures, this coronavirus appears to be less fatal than SARS (severe acute respiratory syndrome) with a less than 3% fatality rate so far. Comparatively, in 2003, the SARS virus affected over 8,000 individuals, with a fatality rate exceeding 9% over eight months, according to the World Health Organization. While apparently less fatal, the virus seems to be significantly more contagious than SARS. So, the apparently lower mortality rate versus SARS may still result in a death toll from the 2019-nCoV outbreak exceeding that of SARS.
Events are harming sentiment as well as economies. In China and Asia, near-term business activity has been significantly impacted as people curtail their movements, and counties restrict cross border travel. Reports are prevalent about people in China canceling travel plans, social interactions and outings, leaving restaurants, cinema theaters, and hotels empty. As China has become an integral part of the global supply chain, any further extension of factory closures raises risks related to supply chain disruptions for multinational companies. In sum, the situation remains fluid and is expected to worsen in the near term. The rapid development of the 2019 coronavirus has brought some uncertainty to the near-term global growth outlook.
 Our current view is a short-term negative economic impact and a neutral impact over the medium-term. This view could change quickly. There is a real possibility of a large outbreak in additional countries, and while the virus evolving into a global pandemic is a low probability, that scenario cannot be ruled out. Our long-term view is that when the dust settles, the companies which are the most impacted yet can survive may offer compelling valuations if they are sold off during a panic, realizing sometimes compelling valuations go even lower before reaching a final low point.
|
Strategy Shifts and Other Activity
Both last quarter and the current quarter have involved a higher than normal amount of activity. We are making several strategic shifts we have discussed in previous letters and noted below. We expect activity to return to normal after this quarter.
-
Model Balancing
- Strategy shifts have created more needs to balance holdings than normal. For most holdings, we have completed the selling and will be reinvesting shortly, or during the quarter.
-
Tax-loss Selling
- Where reasonable, we sold holdings with losses during December to offset taxable gains.
-
Transaction Costs
- Our custodian, Charles Schwab, recently removed commissions on most individual stock transactions. This change allows us to utilize individual stocks in more portfolios.
-
Global Bonds Strategy Shift
- Finding bonds with reasonable yield is challenging. Due to the market and economic environment, we are choosing to avoid long-term bonds and low-quality corporate bonds but participate in sovereign bonds of countries that are paying greater interest rates than their peers.
- We are retaining 2/3rd of our bonds in short-term US Treasury bonds. The remaining 1/3rd has shifted to an active global fund managed by Franklin Templeton.
-
Risk Managed Strategy Shift
- Historically, our Risk Managed Strategy utilized broad-based market indexes, and risk reduction has been driven by reducing positions in favor of cash.
- Currently, there is a historically large disparity between the valuation of various stocks for which broad-based indexes do not effectively provide exposure. Examples include: Growth vs. Value, Stable vs. Volatile earnings, US vs. International, Large vs. Small.
- Therefore we have begun to use an active manager in this strategy (GMO), who utilizes an unconstrained approach to seeking value wherever it may reside.
- In this selection, we were not only mindful of overall track record but specific performance during and after periods of expensively valued markets and during times of market stress, specifically 2000 and 2008. The strategy not only lost far less than the major indices during those years but also strongly participated in the increase during the following years. Of course, past performance does not guarantee us anything, but their value drive strategy has weathered previous storms, and we believe is a prudent choice for the current market environment.
-
Focus Strategy Shift
- All three of our individual stock-based strategies, Quality Focus, Income Focus, Opportunity Focus, are increasing our emphasis on value-driven selections over growth-driven.
Conclusion
If you have thoughts or questions about any of the information we’ve shared, or on any other subject, please don’t hesitate to call us. We are grateful you allow us to serve you and your family, and we will continue to make every effort to justify the trust you’ve bestowed on us.
Sincerely,
Your CCA Investment Team
Advisory services offered through Cravens & Company Advisors, LLC, an SEC Registered Investment Advisory Company. Securities offered through and advisory services may also be offered through, FSC Securities Corporation, an Independent Registered Broker/Dealer. Member FINRA/SIPC. Not affiliated with Cravens & Company Advisors, LLC.
Investing involves risk including the potential loss of principal. Investing involves risk including the potential loss of principal. International investing involves additional risks including risks associated with foreign currency, limited liquidity, government regulation, and the possibility of substantial volatility due to adverse political, economic and other developments. The two main risks associated with fixed income investing are interest rate and credit risk. Typically, when interest rates rise, there is a corresponding decline in the market value of bonds. Credit risks refer to the possibility that the issuer of the bond will not be able to make principal and interest payments. Investments in commodities may entail significant risks and can be significantly affected by events such as variations in the commodities markets, weather, disease, embargoes, international, political, and economic developments, the success of exploration projects, tax, and other government regulations, as well as other factors. No investment strategy can guarantee a profit or protect against loss in periods of declining values. Past performance is no guarantee of future results. Please note that individual situations can vary. Therefore, the information presented here should only be relied upon when coordinated with individual professional advice. Any opinions or forecasts contained herein reflect the subjective judgments and assumptions of the authors only and do not necessarily reflect the views of FSC Securities Corporation. There can be no assurance that developments will transpire as forecasted and actual results will be different. Data and analysis do not represent the actual or expected future performance of any investment product.