Quarterly Investment Letter
4rd Quarter 2017
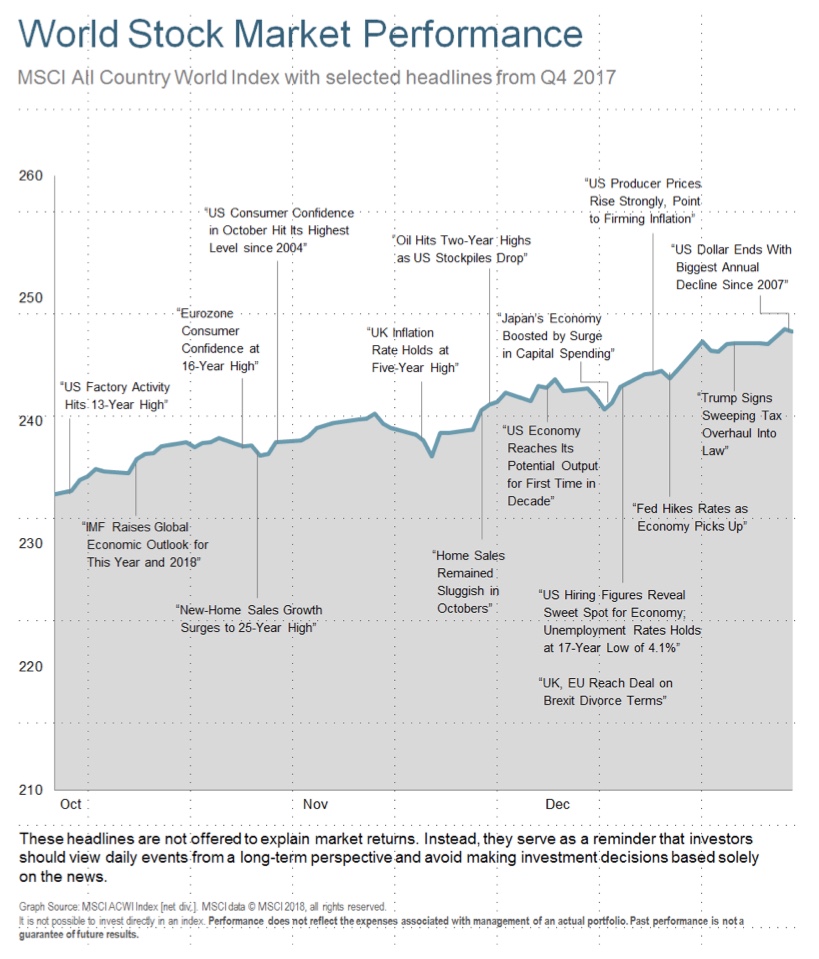
Global equity markets advanced in US-dollar terms during the fourth quarter of 2017. Investors mainly focused on continued indications of positive economic growth from several regions and expectations surrounding tax reform in the United States. The International Monetary Fund (IMF) in October upgraded its forecast for global growth to 3.6% in 2017 and 3.7% in 2018 (versus 3.2% growth in 2016).1 The IMF cautioned, however, that recovery from the 2007–2009 global financial crisis remains incomplete, and that latent risks could return as central banks pivot away from extensive stimulus. The MSCI All Country World Index generated a 5.8% total return in US-dollar terms for the fourth quarter.2 Emerging-market stocks, as measured by MSCI indexes, collectively outpaced the global index as well as their developed-market peers, which overall narrowly trailed the global index.2 Regionally, Asian and US stock markets surpassed the global index’s result, while European bourses finished with a relatively modest advance and Latin American markets fell as a group.2
Americans expressed a high level of positivity in their views on present conditions and future expectations, pushing The Conference Board's Consumer Confidence Index increased to its highest point since the early 2000s in November. This closely watched gauge was bolstered by optimism about the US labor market. Labor market data continued to portray a relatively familiar picture of solid job creation accompanied by lackluster wage growth. Heading into December, America was enjoying broad-based job creation amid an unemployment rate of just 4.1%, the lowest reading since 2000.6 Moreover, the manufacturing unemployment rate was just 2.6%, the lowest ever recorded.3
In December, the US Federal Reserve raised short-term interest rates to a range between 1.25% and 1.50%. Meanwhile, third-quarter US gross domestic product (GDP) came in ahead of consensus estimates and marked the first increase of at least 3% in consecutive quarters since 2014.4 Existing-home sales, which make up about 90% of US home sales, hit their highest level in nearly 11 years.5
European equity markets struggled to maintain their upward momentum during the fourth quarter.2 Investors weighed mixed corporate earnings reports, generally positive economic data, hopes for US tax reform and some progress in talks regarding the United Kingdom’s withdrawal from the European Union. The European Central Bank announced that its bond-buying program could be extended beyond September 2018, adding another nine months to the timeframe, while reducing the value of monthly purchases.6 The move was largely seen as indicating that the ECB believes the Eurozone needs less support from the bank, while not signifying an aggressive withdrawal of stimulus measures.
Asian equity markets surged in the fourth quarter, boosted by generally positive economic data.2 Further support came from Japan’s elections, in which Prime Minister Shinzo Abe’s governing coalition won in a landslide, with many investors taking the result to indicate a continuation of market-friendly policies. Japan’s preliminary third-quarter GDP grew at 2.5% annualized.7 China’s third-quarter GDP growth was 6.8% annually.8 South Korea’s third-quarter GDP grew 3.8% year-on-year. In late November, South Korea’s central bank raised interest rates for the first time in six years. 9
Latin American bourses collectively fell, led lower for the quarter by a plunge in Mexican equities and a pullback in Brazil.2 Meanwhile, most other regional equity markets posted solid gains, led by stocks in Argentina.2 Sentiment in the country was boosted by legislation perceived to be business-friendly, as well as an upgrade of Argentina’s credit rating by Moody’s Investors Service due to the likelihood that reforms would continue and sustain the country’s return to positive economic growth.10 However, political unrest in Brazil and ongoing renegotiation talks about the North American Free Trade Agreement likely contributed to some investor pessimism in the region.
Looking Forward
We doubt anyone would argue about whether stocks have had a good run since their financial crisis bottom in March of 2009. In terms of time, the current expansion is the second longest on record and the momentum seems to have only grown stronger in the new year. The US and international stock markets have now set records for number of days since a 5% pull-back.
To provide some additional perspective:
|
|
5% |
10% |
20% |
|
Average number of trading days before a correction |
41 |
132 |
452 |
|
Current number of trading days since a correction |
404 |
518 |
2,253 |
Table11
We presently see even more signs of bullishness from individual investors as well as professional managers. Of course, these are both contrarian indicators which suggest caution. While we won’t try to predict when, we are extremely confident that like all streaks, this one will come to an end as well.
Rather than overly worry about an inevitable pull back or make arrogant attempts to time it, we take comfort in knowing they are actually common components of bull markets. Pull backs of 5-10% are quite common and there are also numerous historical examples of corrections in the 10-20% range. When a decline is not accompanied by economic weakness, they are normally short-lived. These “bull-market corrections” historically average 13% over 4 months and, on average, take 4 months to recover. A great case in point is the correction that occurred between November 3rd, 2015 and February 11th, 2016. The S&P 500 Index lost approximately 14.25% in a bit over three months. Since then, the index has gained approximately 35% from the previous high and over 50% from the bottom in February.12
A “bear market” is generally defined as a correction of 20% or more and is normally accompanied by economic weakness. During these more severe corrections, the market (S&P 500 Index) drops on average 30% over 13 months, and takes approximately 22 months to recover.12
There are many things that could trigger a more severe correction or bear market. Some possibilities are as follows:
- Negative global events
- Recession fears
- Monetary policy becoming overly restrictive
- Economy overheating causing high inflation
- Excessive valuations
- Excessive leverage
- Increases in energy prices
- Concerns over government stability
While there may not be immediate signs of any of these, the clear conclusion is numerous factors can spawn equity market corrections. Sometimes they can be anticipated, but most times they cannot.
Historically, the current valuation level of any asset tends to be a strong predictor of future performance. The problem occurs when there are a number of different techniques used to determine valuation. In addition, an asset could be highly valued based on its history but have a lower valuation relative to other asset classes. Currently, we find many who feel US stocks are overvalued by historical standards. With that said, when comparing stocks to bonds and/or factoring in rapidly increasing earnings estimates, one could conclude that we are closer to fair value.
We are excited about the global economic expansion, reduced regulation, and the new tax law. Working in combination, they seem to be invigorating corporate and consumer spending. This should drive the economy and corporate earnings higher.
On the other hand, we can’t turn a blind eye to the valuation issue. We definitely make investments thinking of long-term return and higher valuations almost always reduce predicted long-term returns. Our conclusion is to maintain discipline in the diversification of our portfolios while trimming our equity allocations a bit to avoid buying over-priced assets. In addition, we increased our allocation to alternative investments that historically have a lower correlation to stocks. We also have some extra “dry powder” (cash) to buy assets at a lower value some point in the future. We hope the overall result of these actions is for us to continue participating in the market’s momentum while buffeting against the inevitable correction when it comes.
Last quarter, we shared a table showing how several hypothetical portfolios rebounded from historical declines. To take that notion one step further, the table below shows the declines incurred by four hypothetical portfolios consisting of traditional blends of stocks, bonds and cash during periods of stress. It also highlights the amount of time it took the portfolio to recover after the decline.
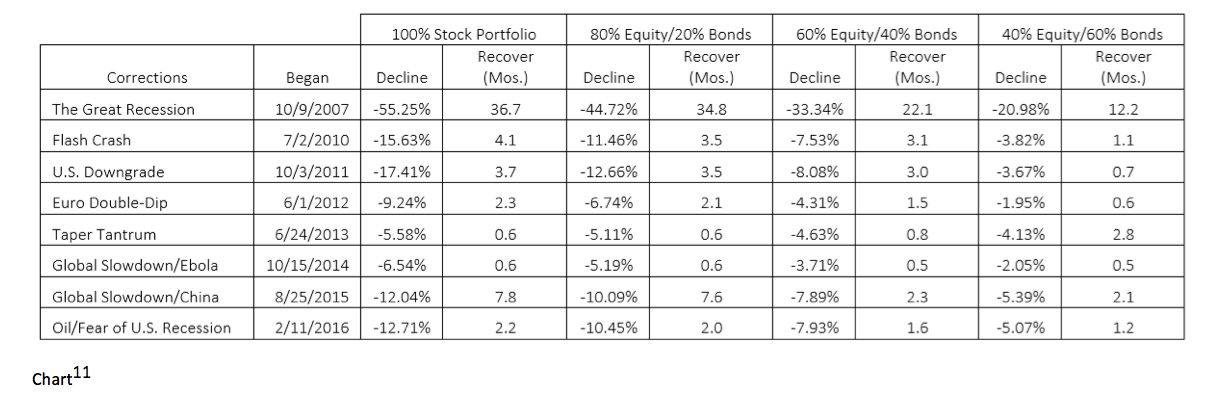
As you can see, in all scenarios the diversified portfolios dropped less and recovered more quickly than the concentrated ones. The design of your investment portfolio is of crucial importance. It should be aligned with your investment time horizon, targeted rate of return, and risk tolerance. Basically, it needs to fit your financial plan. There is no need to take more risk than is necessary to provide you with the greatest likelihood of reaching your goals. This means keeping you diversified, trimming back on areas of your portfolio which have “worked”, or performed well lately. It also means increasing allocations to investments which have not “worked” lately. While these steps may not maximize returns in the short run, they generally provide a better long-term investment experience.
In summary:
- 1. Things are going well economically and the equity markets reflect that.
- 2. We are definitely overdue for downside volatility but that is also a natural component of healthy, rising markets.
- 3. No one can time markets consistently. We do make adjustments to try and reduce or increase risk based on conditions.
- 4. Appropriately diversified portfolios can buffer the impact of the inevitable correction when it comes.
- 5. Focus on goals not markets.
If you have thoughts or questions about any of the information we’ve shared or on any other subject, please don’t hesitate to call us. We are grateful you allow us to serve you and your family and we will continue to make every effort to earn the trust you’ve bestowed on us.
Sincerely,
Your CCA Investment Team
Advisory services offered through Cravens & Company Advisors, LLC, a Registered Investment Advisory Company. Securities offered through, and advisory services may also be offered through, FSC Securities Corporation, an Independent Registered Broker/Dealer. Member FINRA/SIPC and a Registered Investment Advisor. Not affiliated with Cravens & Company Advisors, LLC.
Investing involves risk including the potential loss of principal. Investing involves risk including the potential loss of principal. International investing involves additional risks including risks associated with foreign currency, limited liquidity, government regulation, and the possibility of substantial volatility due to adverse political, economic and other developments. The two main risks associated with fixed income investing are interest rate and credit risk. Typically, when interest rates rise, there is a corresponding decline in the market value of bonds. Credit risks refer to the possibility that the issuer of the bond will not be able to make principal and interest payments. Investments in commodities may entail significant risks and can be significantly affected by events such as variations in the commodities markets, weather, disease, embargoes, international, political, and economic developments, the success of exploration projects, tax, and other government regulations, as well as other factors. No investment strategy can guarantee a profit or protect against loss in periods of declining values. Past performance is no guarantee of future results. Please note that individual situations can vary. Therefore, the information presented here should only be relied upon when coordinated with individual professional advice. Any opinions or forecasts contained herein reflect the subjective judgments and assumptions of the authors only and do not necessarily reflect the views of FSC Securities Corporation. There can be no assurance that developments will transpire as forecasted and actual results will be different. Data and analysis do not represent the actual or expected future performance of any investment product.
-
- 1. Source: World Economic Outlook: Seeking Sustainable Growth—Short-Term Recovery, Long-Term Challenges; October 9, 2017. © International Monetary Fund. All Rights Reserved.
- 2. Source: © 2018 Morningstar, MSCI.
- 3. Source: US Bureau of Labor Statistics.
- 4. Source: US Bureau of Economic Analysis.
- 5. Source: National Association of Realtors
- 6. Source: European Central Bank.
- 7. Source: Cabinet Office, Government of Japan.
- 8. Source: National Bureau of Statistics of China.
- 9. Source: Bank of Korea.
- 10. Source: Moody’s Investor Services.
- 11. Bloomberg. Portfolios represented by the S&P 500 Index for equity and Barclays Aggregate Index for bonds. No asset management fees are charged on these representative portfolios. They are presented gross of fees.
- 12.Source: Goldman Sachs, equity strategist Peter Oppenheimer